Operator Activity Analytics
Opening the Application
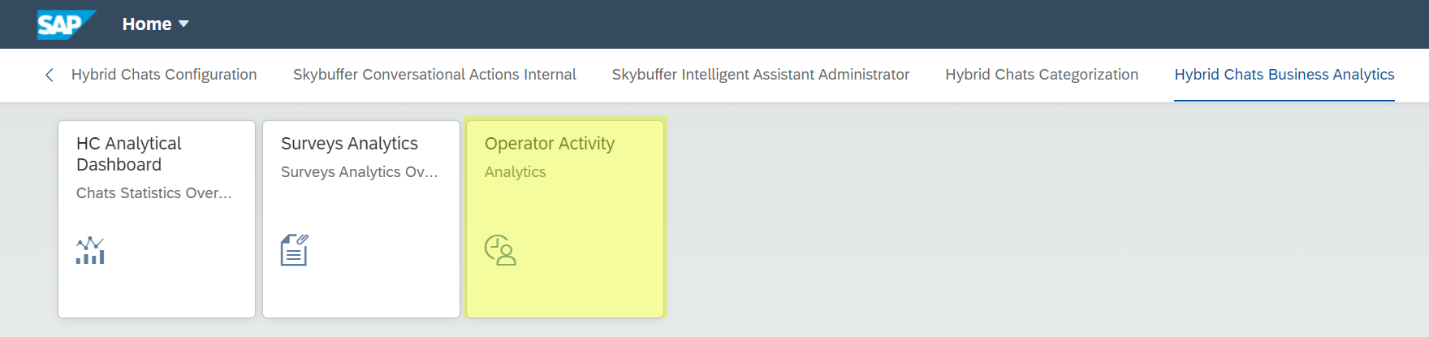
To access the application, navigate to the Operator Activity Analytics in Fiori:
Operator Activity Overview
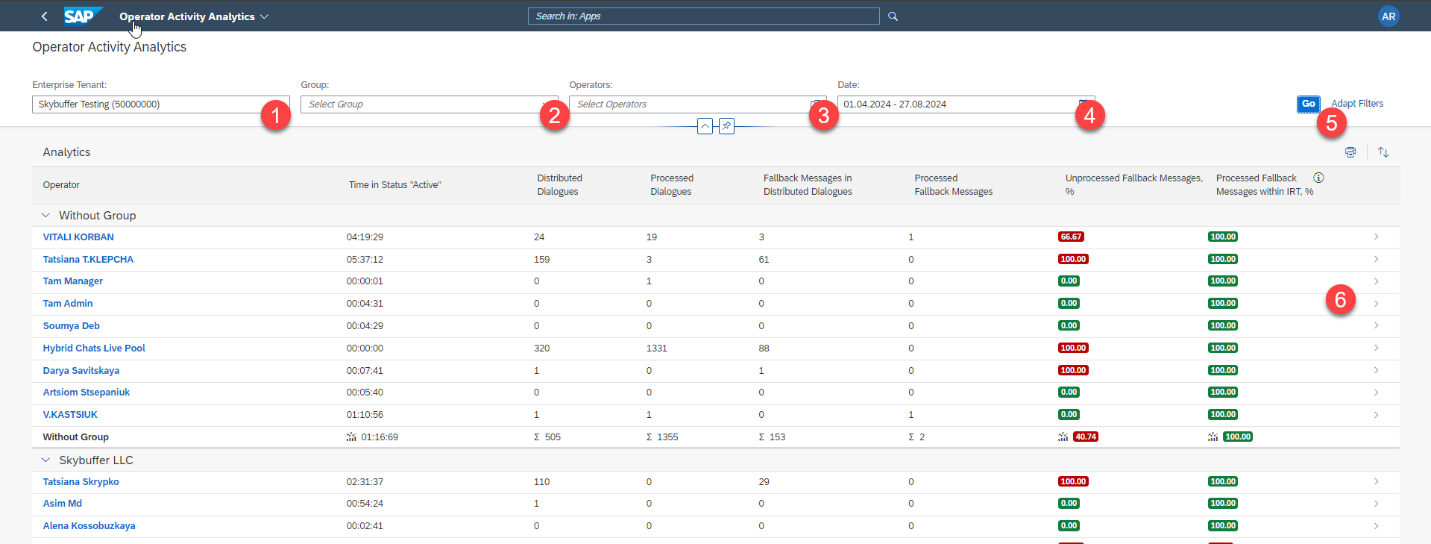
When opened, the application displays a list of data for the last 7 days. If any operator hasn’t been active for that time, they won’t be visible.
You can use the filter panel to find the data you need:
Step 1. Select the Enterprise Tenant. It is common that there is only one to choose
Step 2. Filtering by group
Step 3. Select the specific operators from the list. If left blank, all the operators are included
Step 4. Select the date range
Step 5. Click the Go button to see the results
Step 6. Click on the operator’s name (or click on the arrow icon) to see the metrics for a specific person
The following metrics are available:
- Operator – displays first and last name
- Time in Status “Active” – calculated total time the operator has been in active status in the HC Operator Workplace
- Distributed Dialogues – number of all dialogues distributed to the given operator
- Processed Dialogues – number of dialogues the operator interacted with (assigned, closed, those where the operator wrote to the user, etc.)
- Fallback Messages in Distributed Dialogues – number of messages that cannot have been answered by AI Agent
- Fallback Processed Messages – number of fallback messages the operator has interacted with
- Unprocessed Fallback Messages, % – indicates what percentage of the fallback messages distributed to the operator have not been processed by the operator
The ideal value would be zero, meaning that every message that required attention was handled by the operator, and such values are marked green. Any value above zero is marked in red - Processed Fallback Messages within IRT, % – indicates what percentage of the fallback messages processed by the operator were taken over within the IRT* time limit.
*IRT means “Initial Response Time”, and there is often a time limit/suggested value within which a support agent must respond to a customer’s request. In the case of AI Agent interactions – we are looking at cases where the AI Agent has no response and human intervention is required.
Configurating the IRT Time Limit values
The time period within which the operator has to respond (IRT Time Limit) is synonymous with the delay time for red/fallback messages*.
To set up this value, open the Connector Configuration application and set the correct value for the Delay in seconds for red conversations (UI side) parameter.
Click Save and then press the Push Update and Restart button to save the changes.
(If the AI Agent doesn’t have an answer to a user’s message, the conversation tile changes its colour into red and the workflow stops for some time so that an available operator could join. Hence the delay. If the operator doesn’t step in in time, the workflow continues. For example, a support request might be saved with user’s comment and contact data. It is best for the operator to intervene within the delay time and not later, when the AI Agent has already continued with the conversation).
Operator Metrics
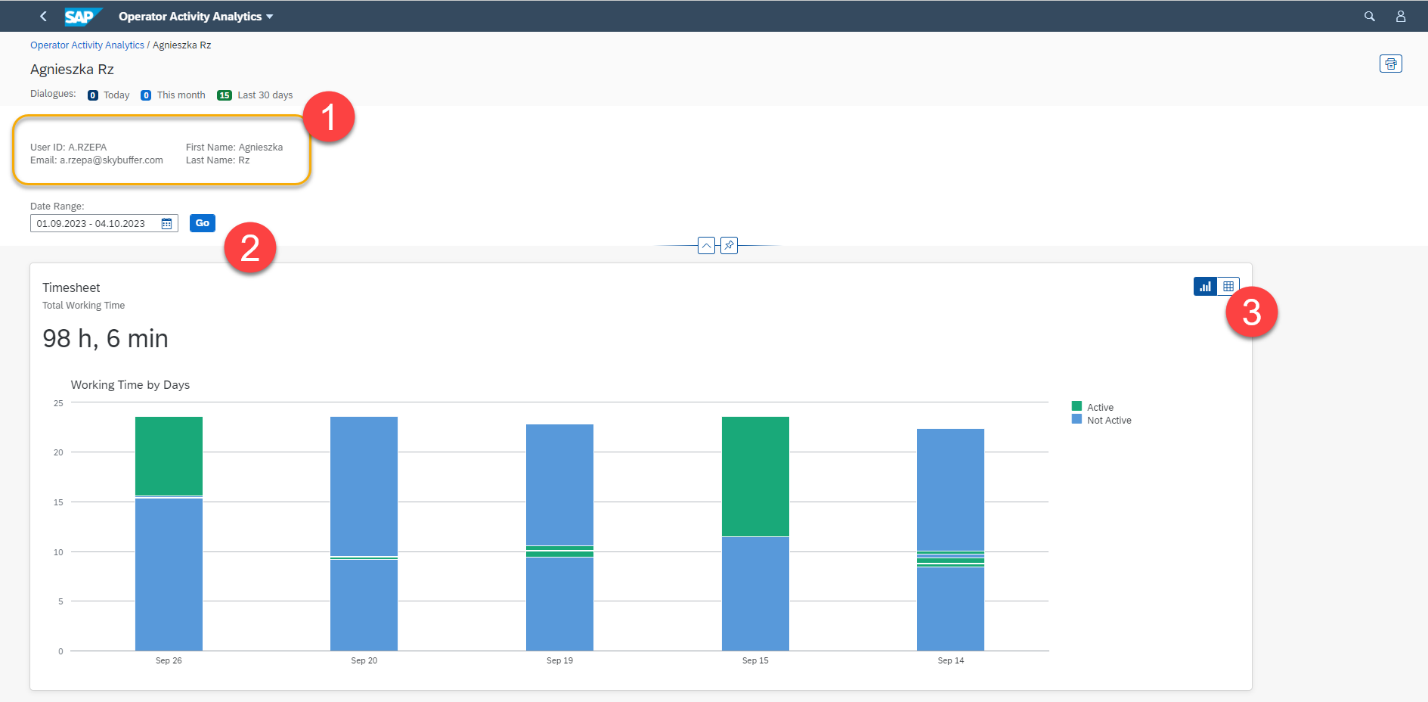
Each operator has a dedicated page with personal metrics.
Step 1. Operator personal details: user ID, name, email
Step 2. Change date range if required and click Go to update the results
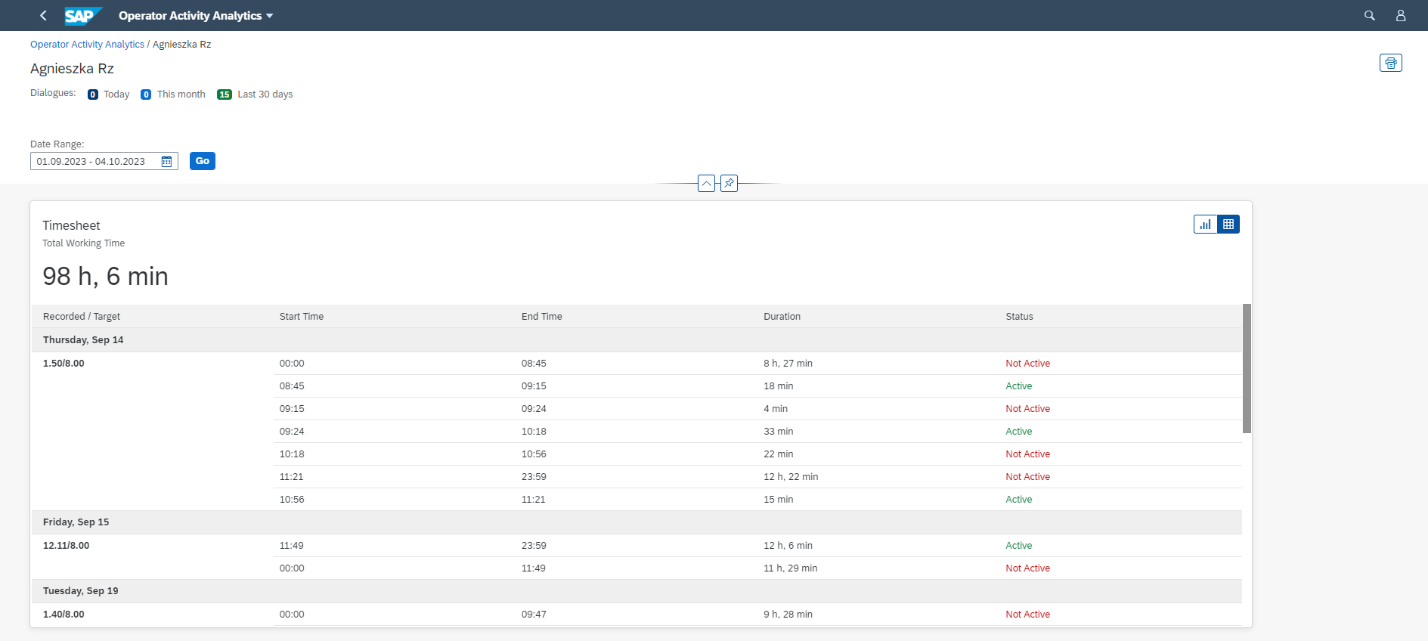
Step 3. Timesheet data. Toggle the button to change the view from the graph to the detailed data table:
The data table view for the timesheet metrics:
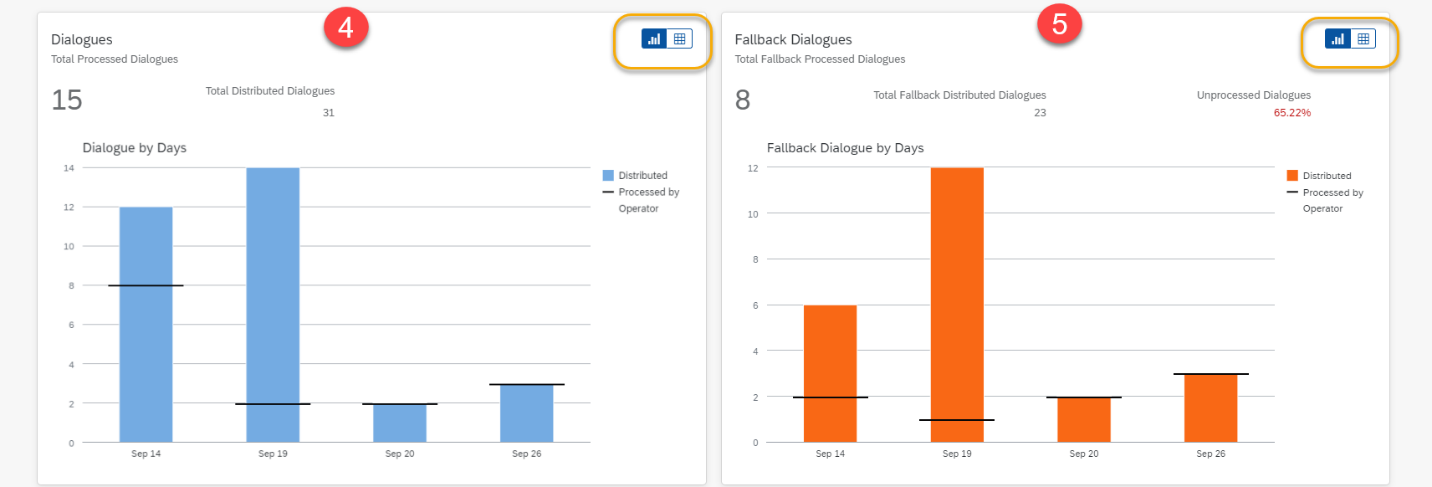
Step 4. Dialogue Metrics
View the distributed vs processed dialogues per day. Toggle the switch in the yellow square to switch from the graph to the data-table view.
Step 5. Fallback Dialogue Metrics
Review the number of the distributed fallback dialogues per day, and the percentage of the unprocessed dialogues.
Toggle the switch in the yellow square to switch from the graph view to the data table view.
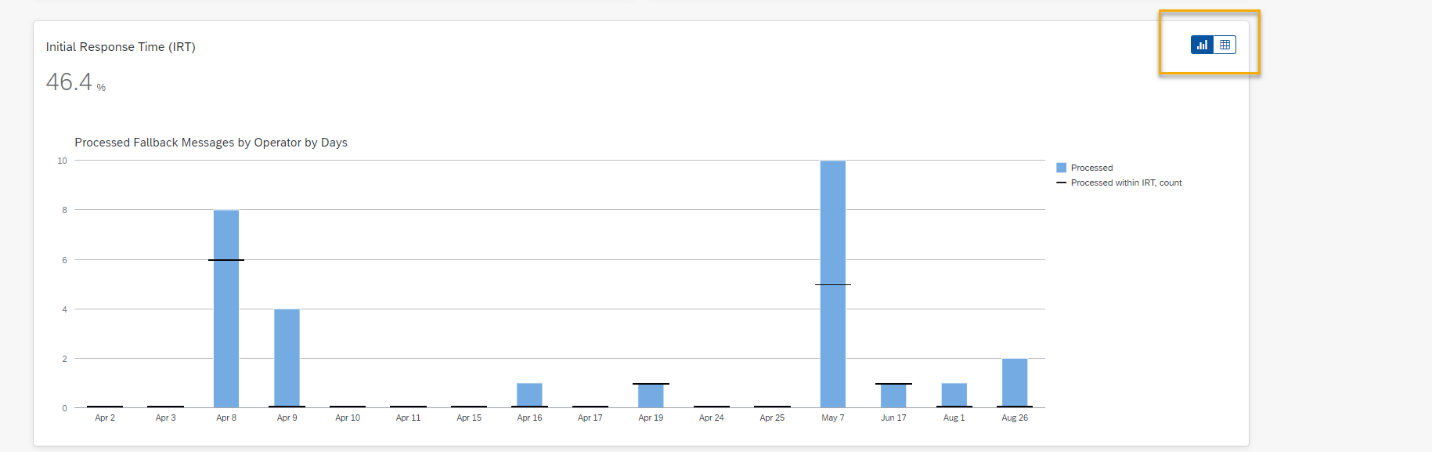
Step 6. Fallback IRT Time Limit Metrics
The application comprises a Response Time Measurement feature. This includes a detailed dataset for each operator.
The blue blocks in the graph show the number of fallback messages processed per day. The black horizontal line shows the number of dialogues processed within the set IRT time limit. Toggle the yellow switch to change the view to a data table.
Example: The operator processed 10 fallback dialogues on May 7th, but only 5 of those dialogues were taken over by the operator within the required time limit.