HC Analytics
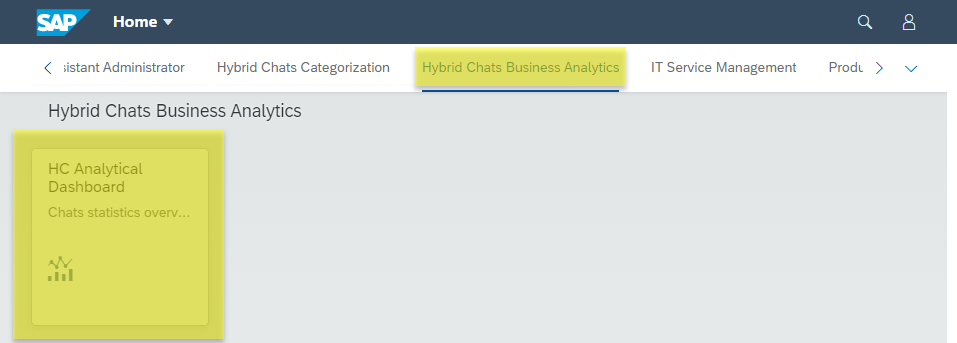
Step 1. Please find Hybrid Chats Business Analytics application.
Step 2. Select the Enterprise Tenant from the drop-down list, set the analysis period and push the Go button.
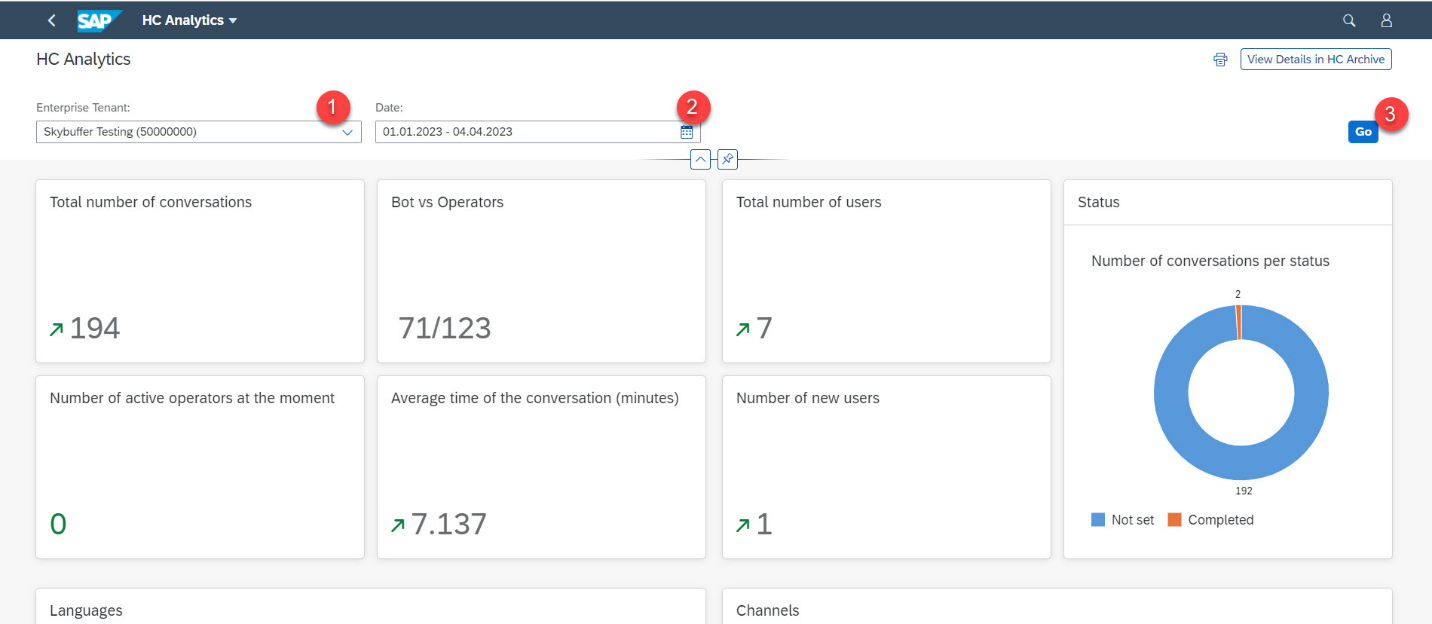
Step 3. Your Analytical Dashboard is ready to be used.
You can find the dialogues data filtered by the number of conversations, users, statuses, languages etc. Below there are a few charts and metrics described further:
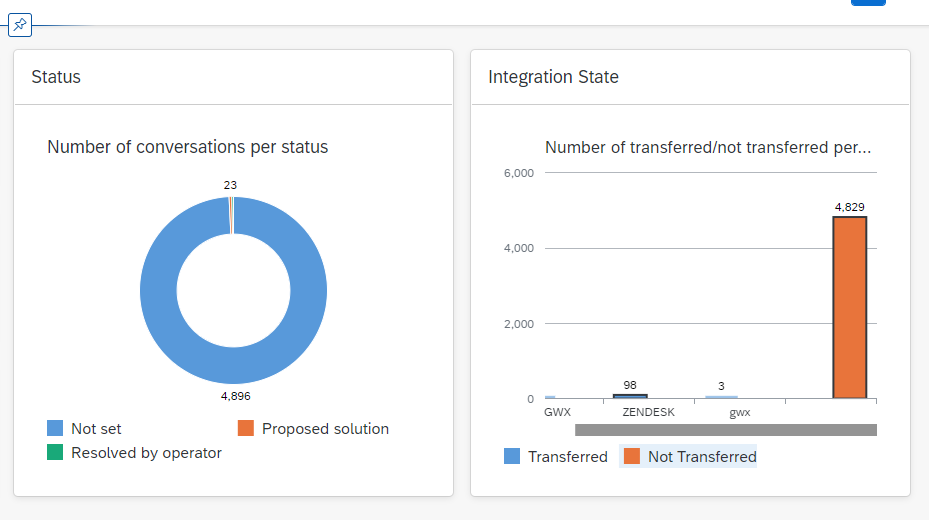
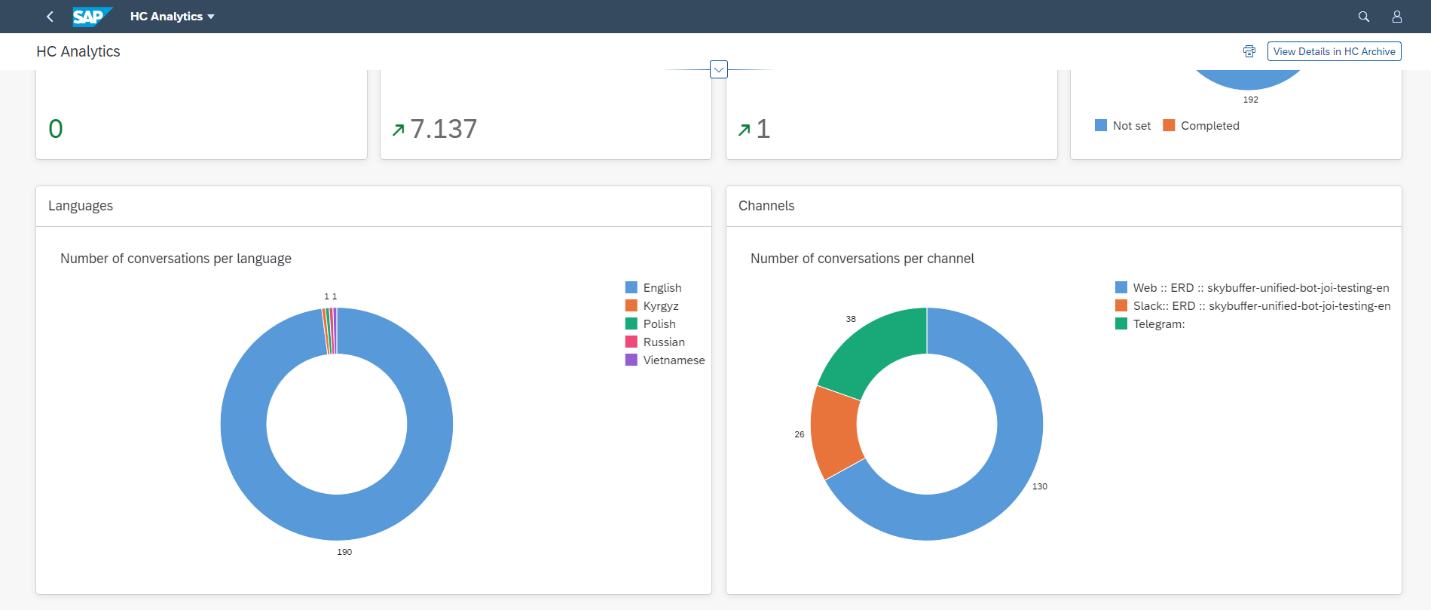
Status Chart: shows a summary of conversation statuses ( e.g. number of conversations resolved by Operator, or resolved by AI Agent).
Integration State Chart: useful when conversations are also shared with external systems. Shows how many conversation logs were totally sent/not sent and where.
Languages Chart: presents mostly spoken languages in conversations
Channels Chart: shows how many conversations were started per each channel (webchat, mobile channels, etc.)
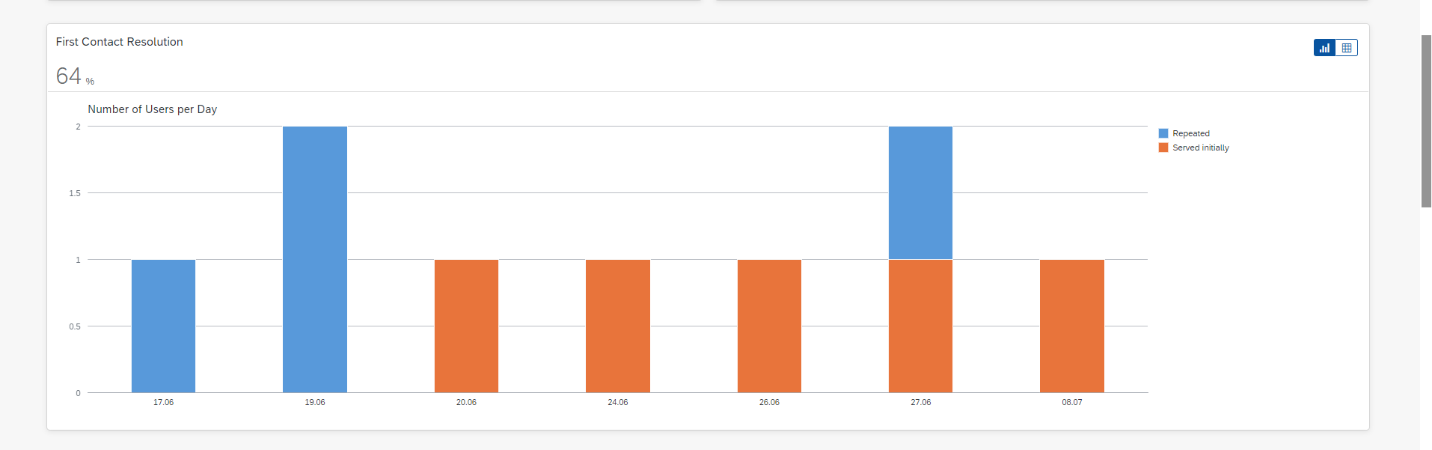
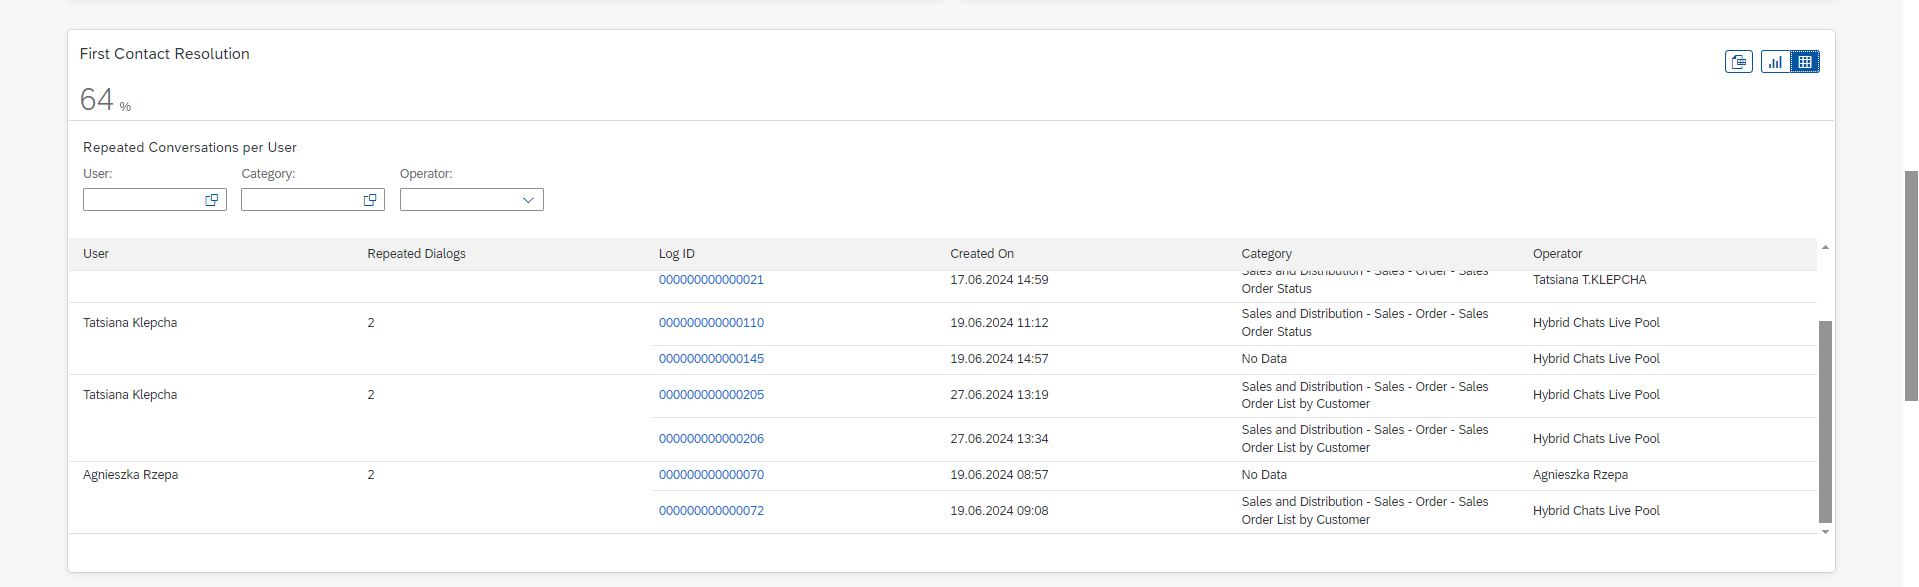
First Contact Resolution Chart
See how many chats were repeated vs how many were served initially. Switch to the table view to see the details and download the excel sheet.
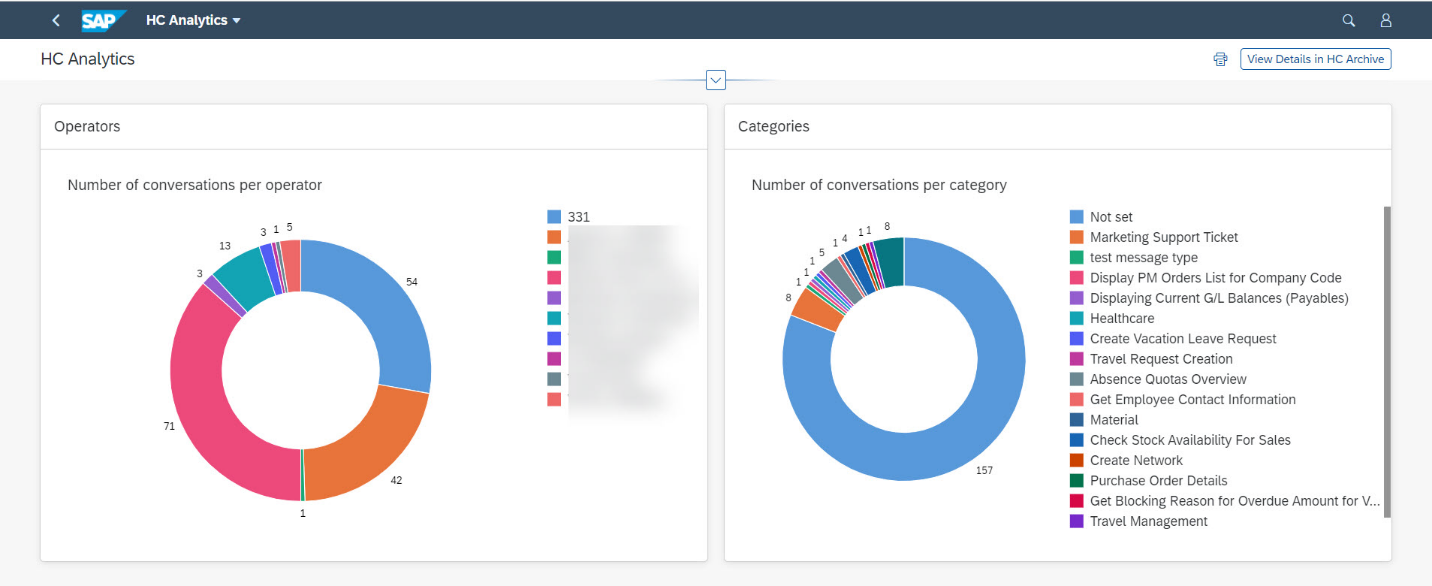
Operators Chart: indicates which operators were most active
Categories Chart: shows the statistics on the conversation categories. It helps to understand which subjects are of most interest to users
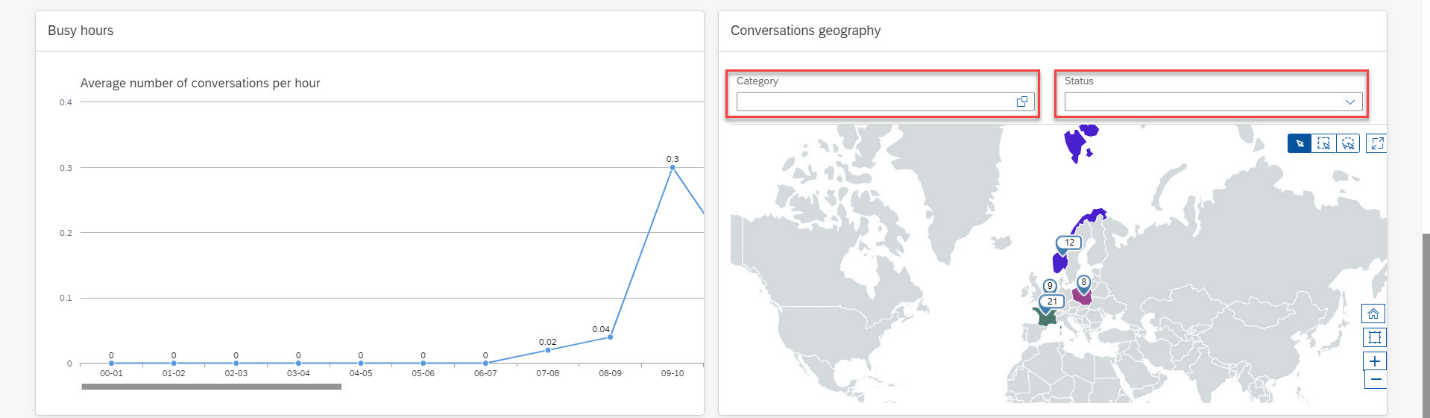
Busy Hours Graph: presents conversation workload per hour. It is helpful to organize operators work
Users Per Category: see what conversation subjects are most common
Conversations Geography Graph: informative map graph, shows nationalities of registered users. Optionally, it has status and category filters
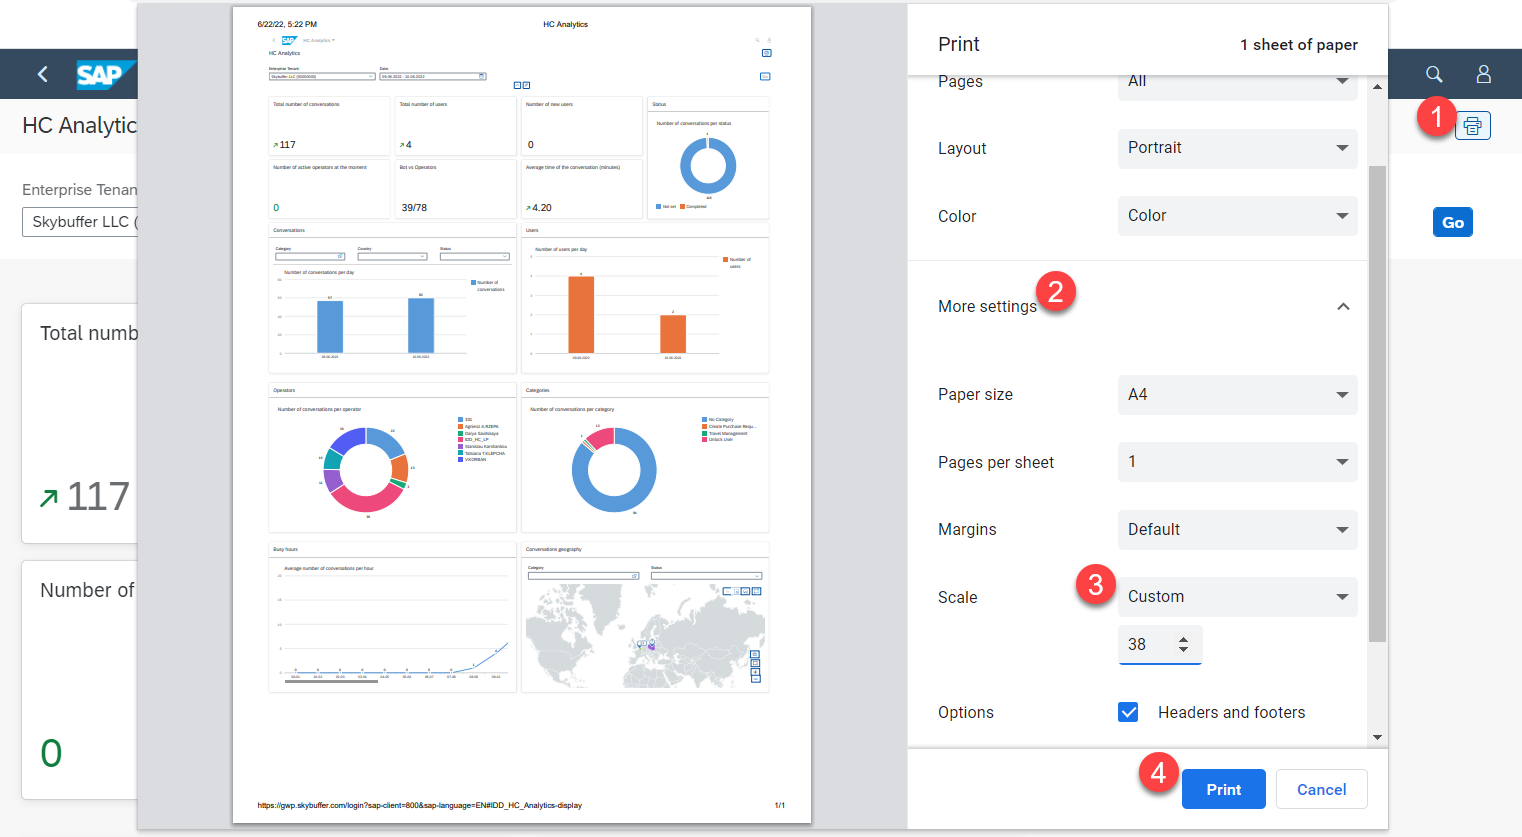
Step 4. Print out your Analytical Dashboard:
Click the Print button in the top right-hand corner
Select More settings
Set Custom Scale and enter the most relevant value
Click the Print button
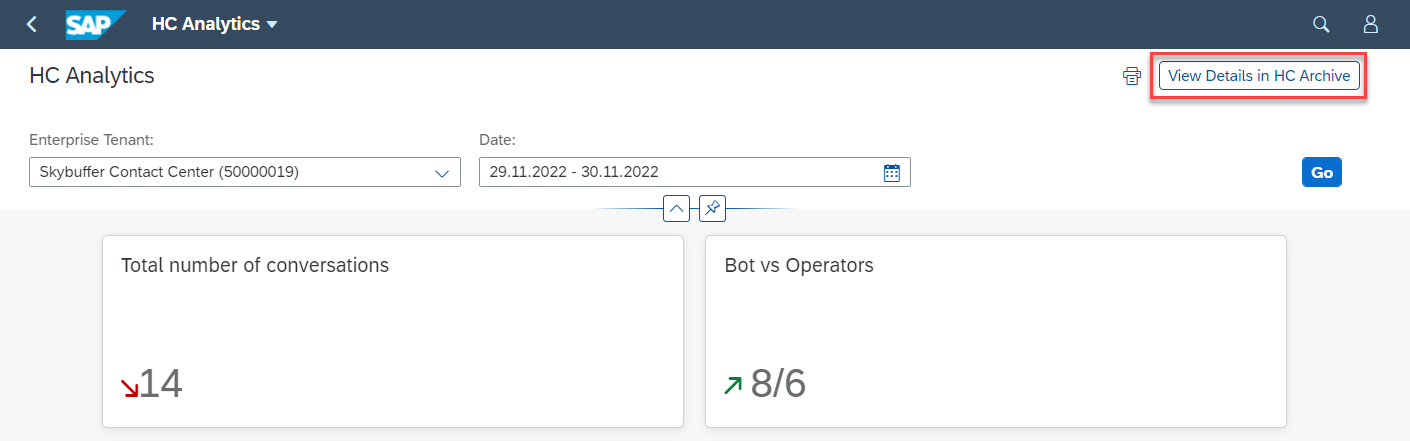
Step 5. You can always use the button View Details in HC Archive to quickly go to Hybrid Chats Archive application and see directly the dialogues set in accordance with the selected filters.