Exit Survey Analytics
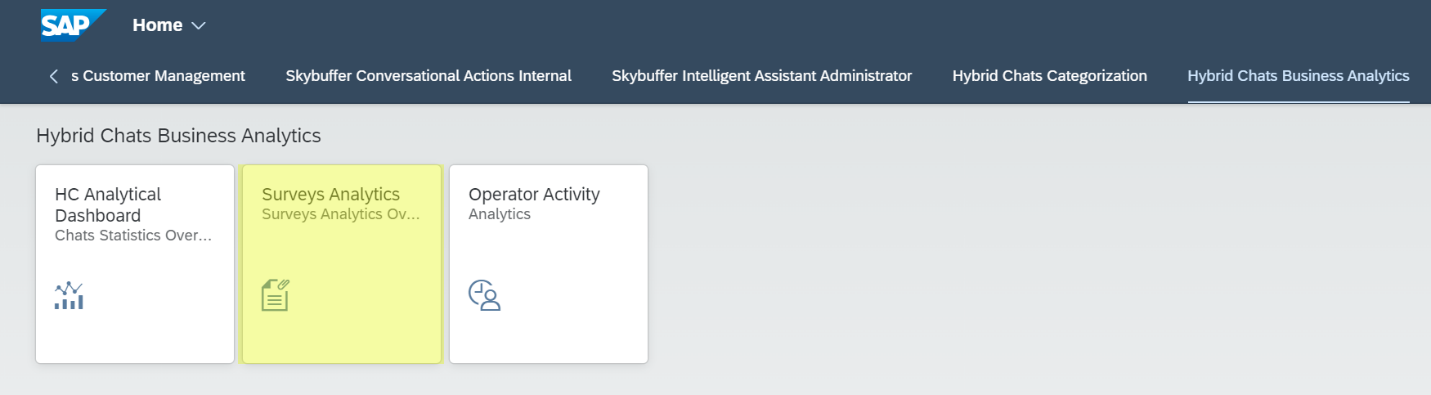
Step 1. Please find the Survey Analytics application:
Step 2. Select the correct tenant, channel name and date range at the top. Optionally, you can also select a chat category or even a specific log ID.
Step 3. Click the Go button to see the results.
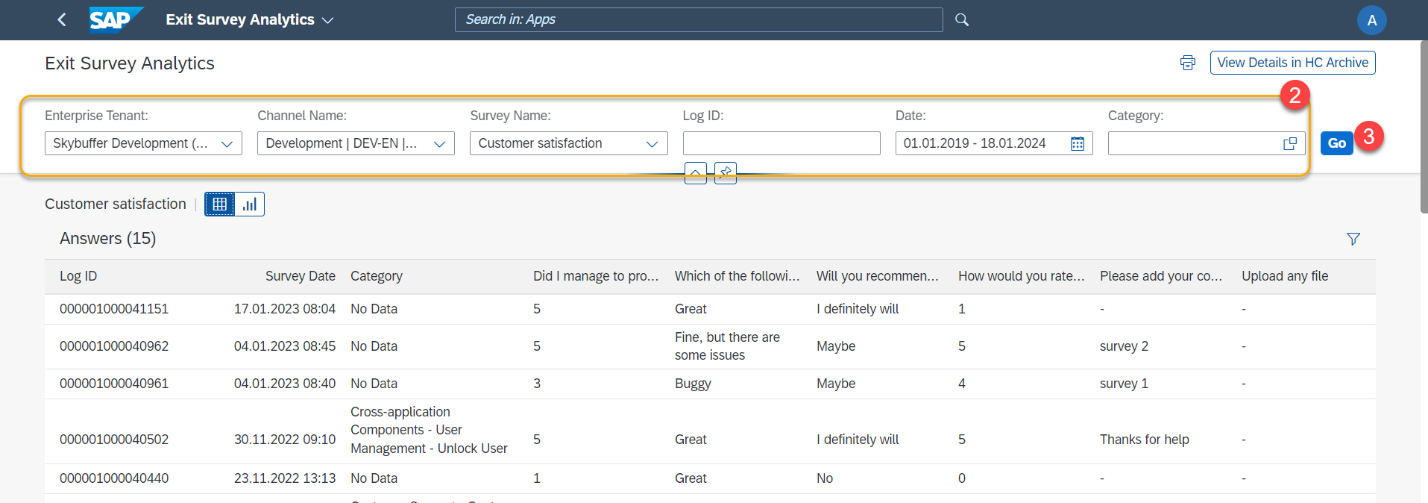
The first and second columns are set – they contain the log ID (i.e. the chat ID), and the date of the chat. Each of the remaining columns represents a poll question.
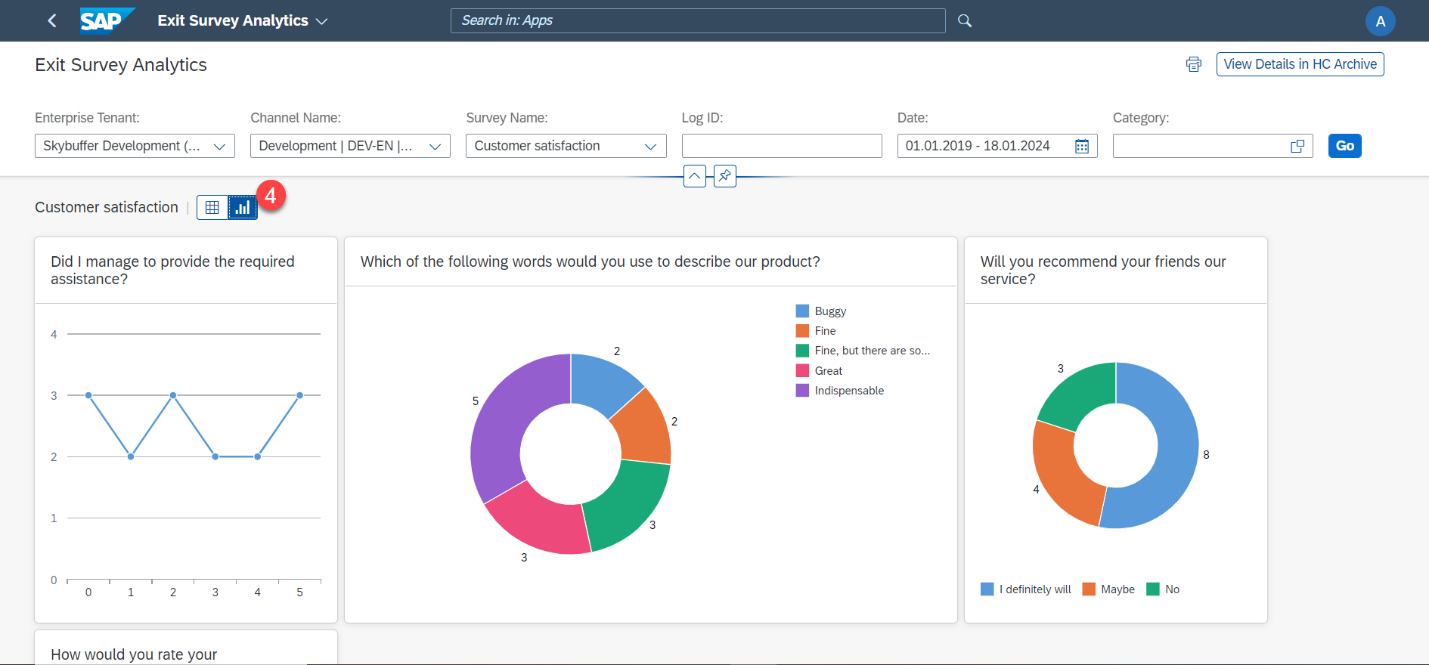
Step 4. Graph View
Toggle the switch marked below to see the data presented in the charts and graphs.
NOTE: Answers of the Text, Date, and File types are not represented in this view.
Step 5. Filter Results (applies to Data Table view only).
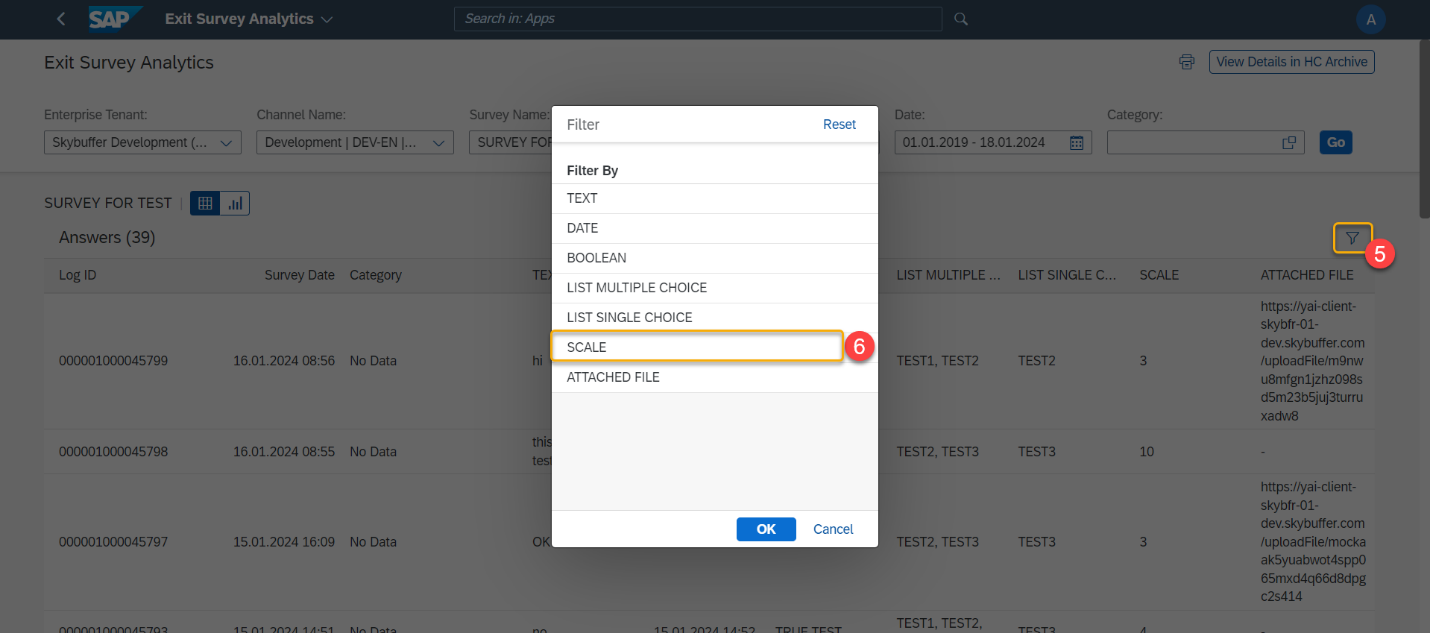
Click the Filter icon on the right. You will see the filtering options – each for a question in the survey.
Step 6. Click the filter option you want:
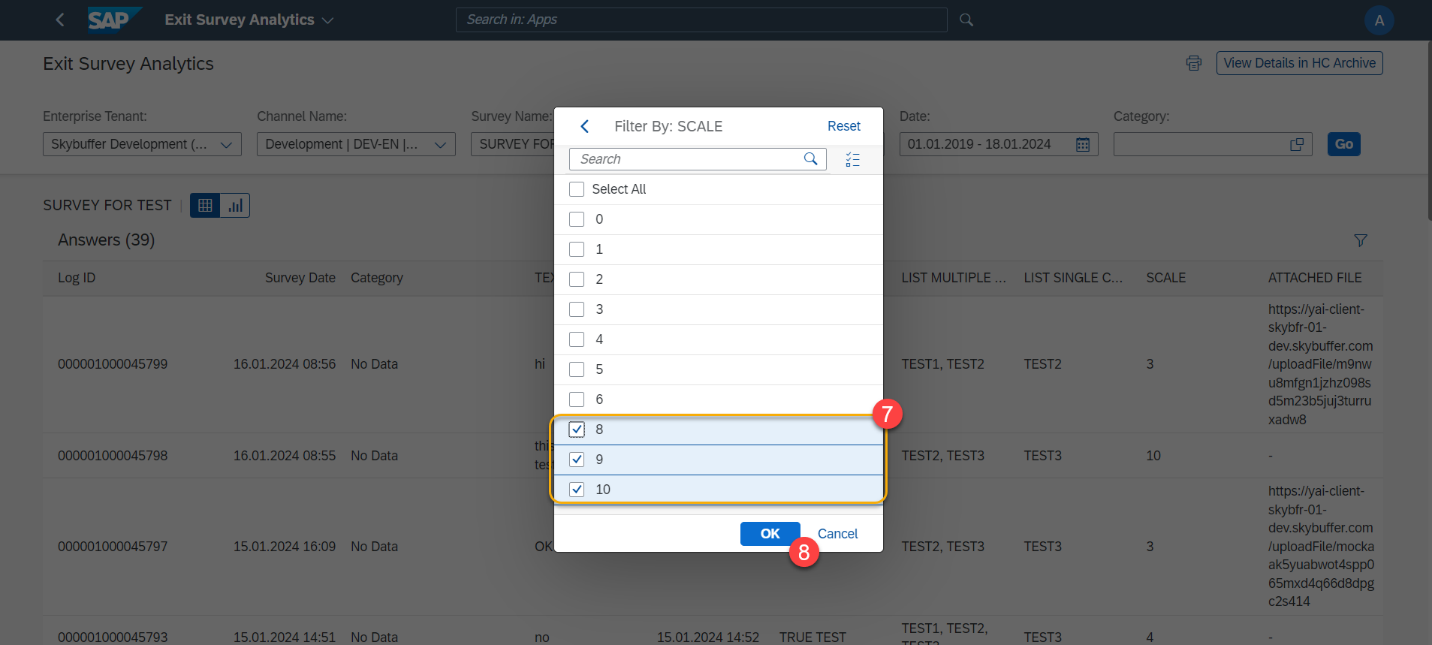
Step 7. Select the values to filter
Step 8. Click the OK button to save the filter. You will see a new set of the filtered results
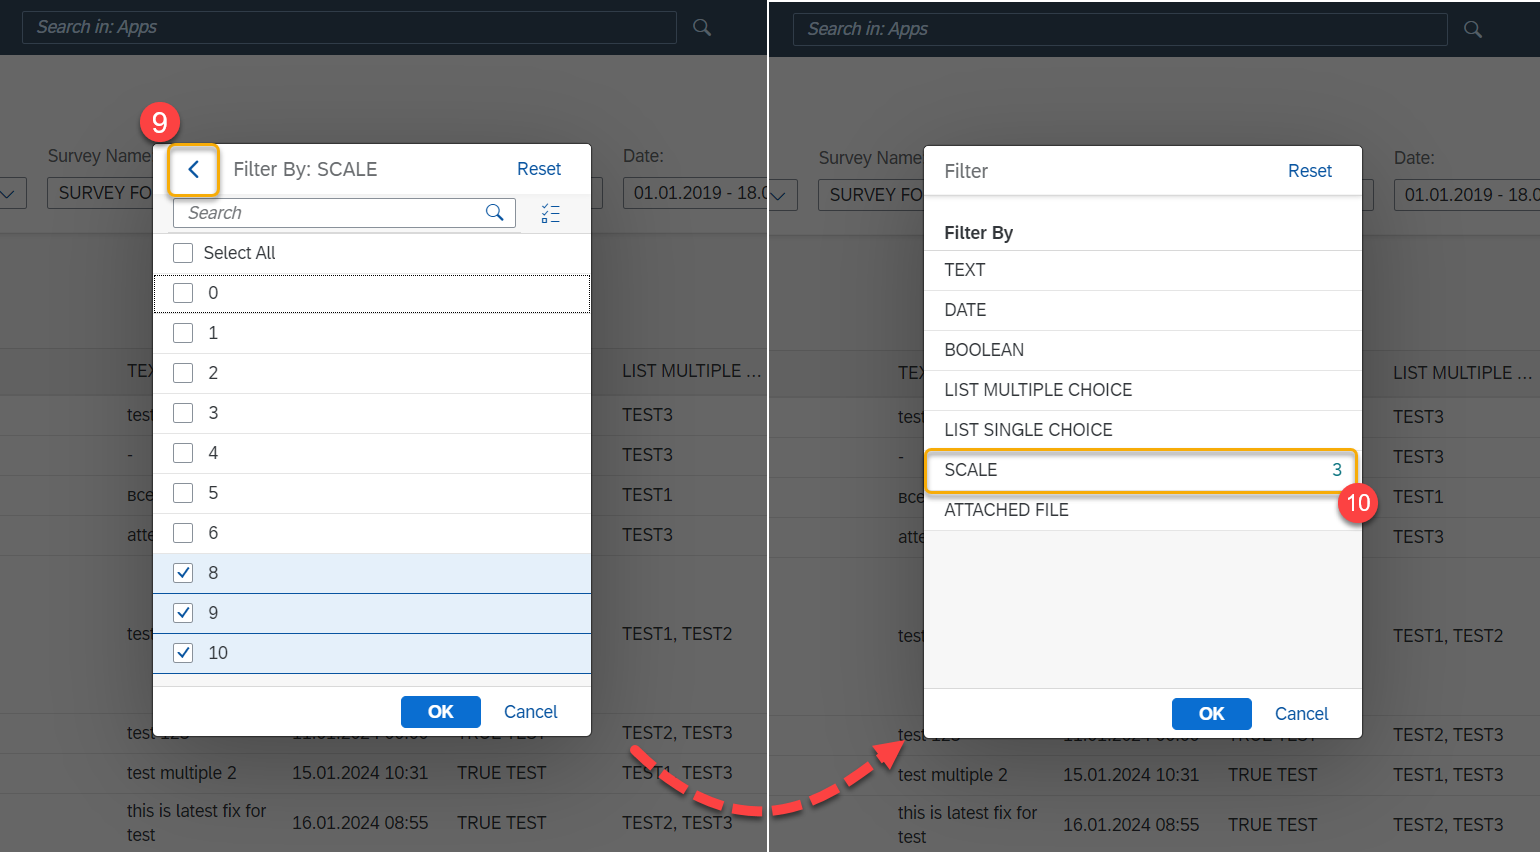
Step 9. When here, you can also press the Back button to see all the available filters again. You can use many filters at once
Step 10. The filters in use will usually have a count of the selected filtering options next to them
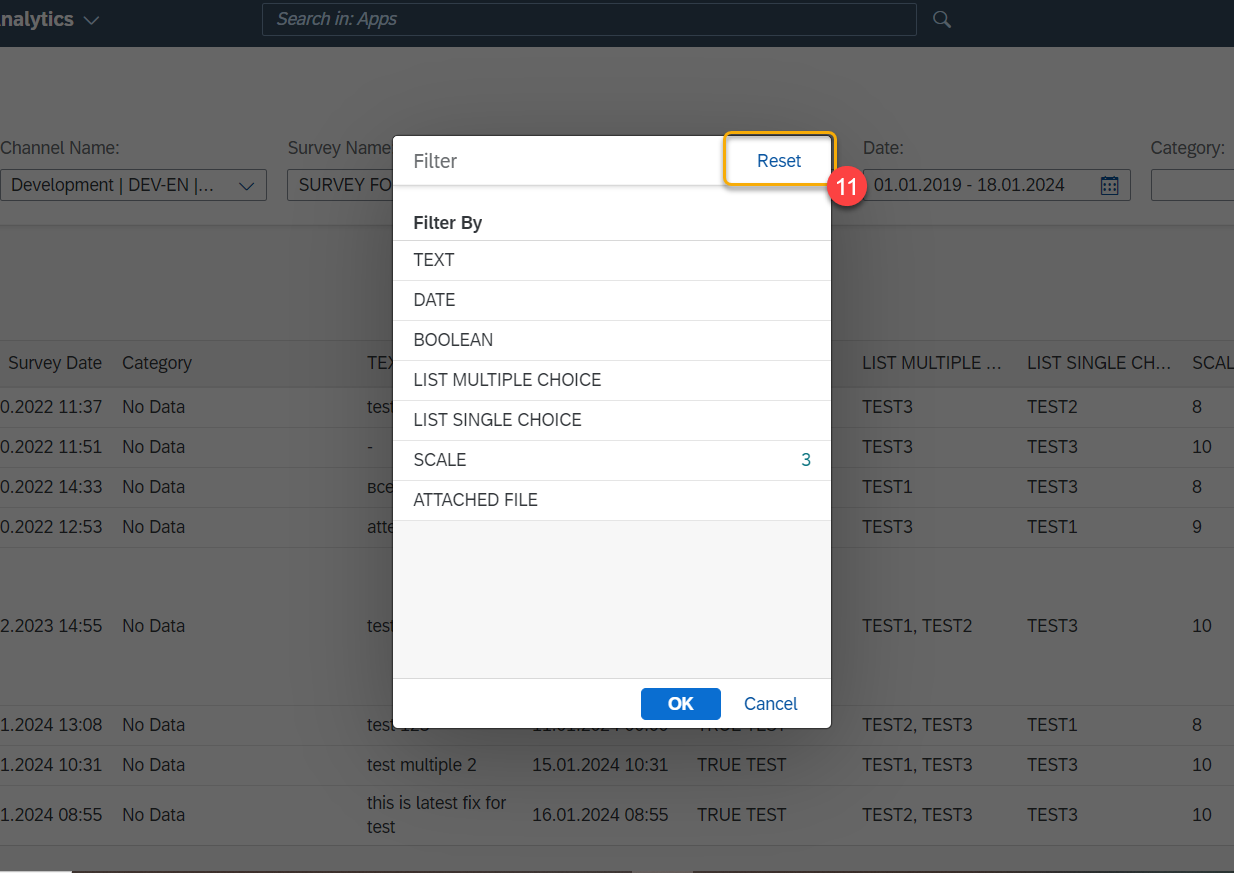
Step 11. Press the Reset button to clear all filters. Click the OK button to update the result
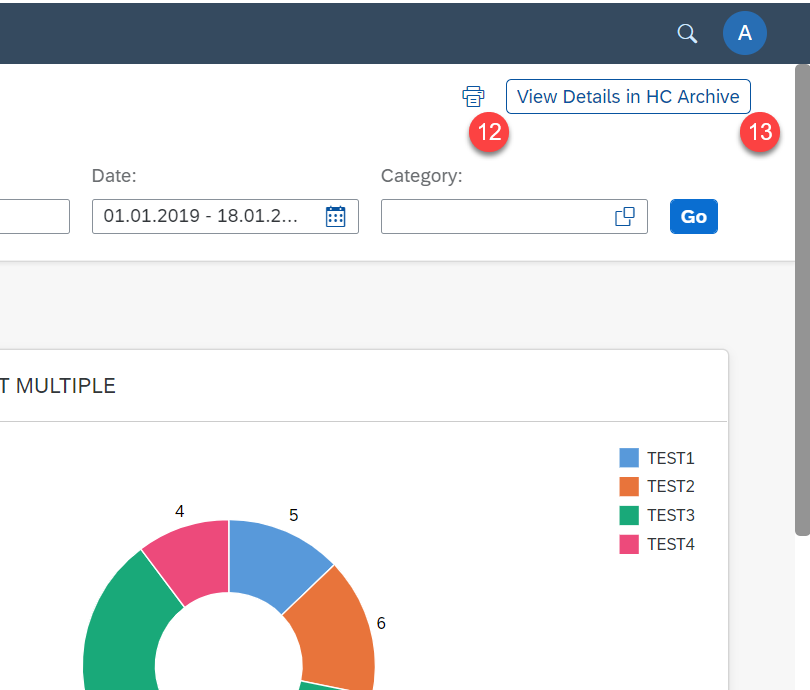
Step 12. Click the Printer icon to print out the page
Step 13. Click the View details in HC Archive button if you want to view the same records in the HC Archive application