Monitor Section
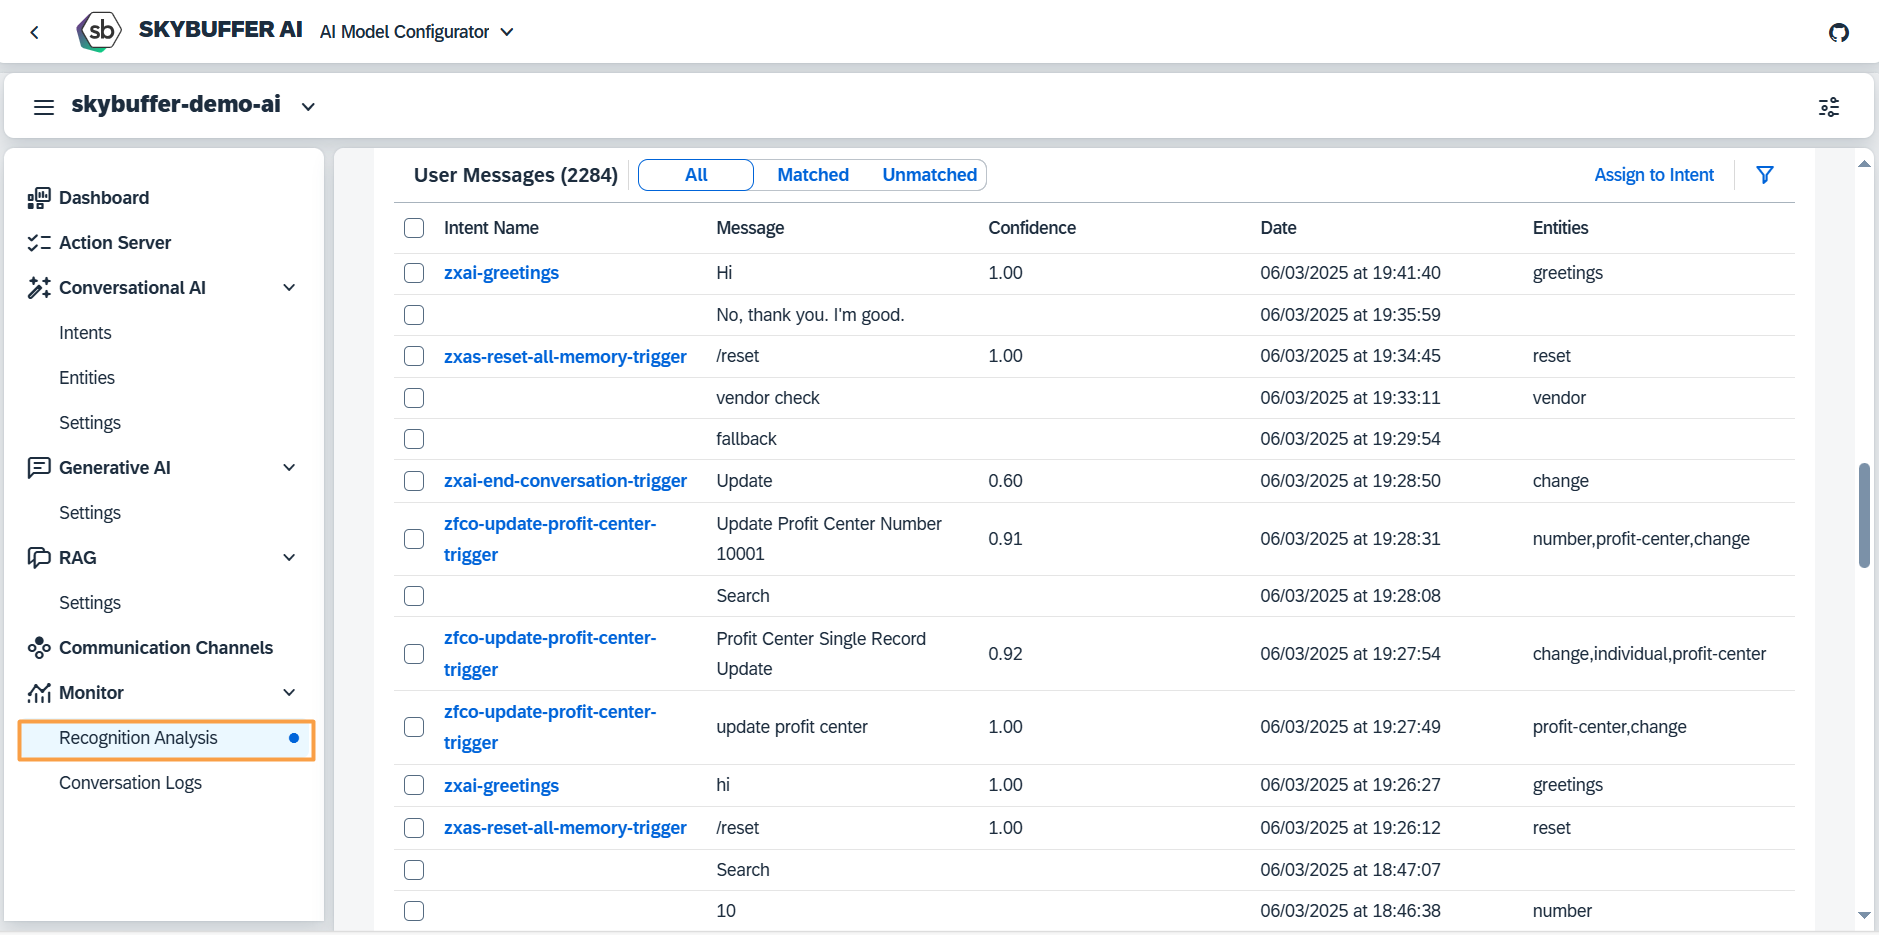
To analyze your conversations with the AI Agent, go to the Monitor section. Here you can see two options for monitoring: Recognition Analysis and Conversation Logs.

Step 1. Display user phrases
Information about users’ phrases is available in the Recognition Analysis section with Intent Name, Message, Confidence as well as detected Entities.
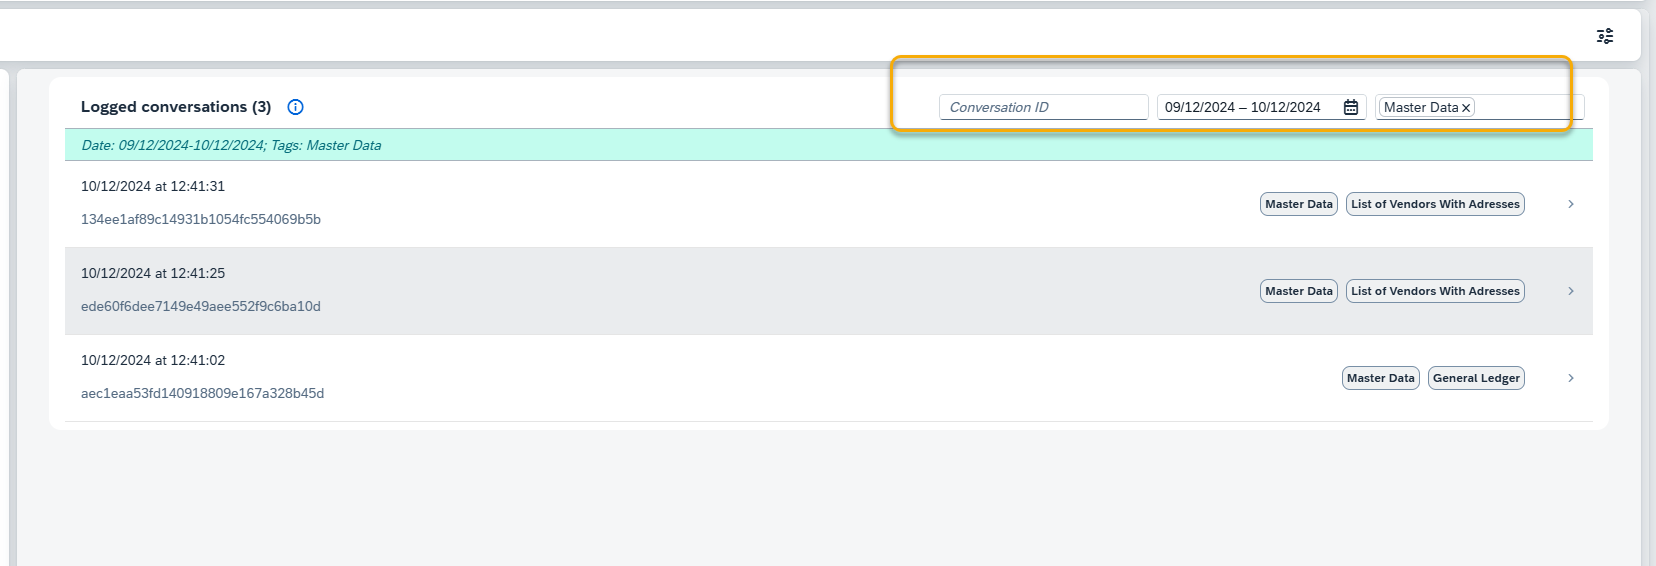
Step 2. Browse and display conversation logs
For each conversation log there is a specific ID, date and time of conversation, and Tags on the right side of each row (optional).

There is a set of filters available in the top-right corner of the page:
Conversation ID – paste in one log id number to see the one conversation.
Date Range – select from- to dates, it can be also one day.
Tags – select one or many tags to filter out the logs. If you use many tags at once, they will work with OR operand:
“Select tags that are marked with Tag1 OR Tag2 OR Tag3 etc.”
Step 2. Display the dialogue
Press on a row with given log to see the actual conversation.

Step 3. Check conversation memory and technical logs
Press the Open Details button under any message and check Dialogue Analysis and Debug Information.
Dialogue Analysis Tab displays the state of the model’s memory after the user message was processed.
Debug Information Tab shows what skills have been triggered after the user message, and what actions were run inside each skill.

